
Orange Photonics – ผู้ผลิตเครื่องมือวัด เครื่องทดสอบสารสำคัญจากผลิตภัณฑ์ กัญชง กัญชา (Cannabis Analyzer Model LightLab 3) โดยใช้เทคนิค Liquid Chromatography แบบพกพา (Portable) สามารถทดสอบนอกสถานที่ (Onsite Testing) เพื่อให้ได้ค่าที่แม่นยำ เพิ่มประสิทธิภาพและความสะดวกสบายในการวัด ภายในระยะเวลาประมาณ 10.5 นาที สามารถวัดค่าองค์ประกอบสาร Cannabinoid ได้หลากหลายตามหมวดการวัด พร้อมฟังก์ชันการเชื่อมต่อ WIFI และรองรับการทำงานด้วยแบตเตอรี่
CANNABIS Analyzer mode LightLab 3 Modules
· Δ9-THC, THC-A, CBD, CBD-A, CBN, CBG, CBG-A (Standard Module)
· CBN-A, CBC-A, CBC, Δ8-THC, Δ10-THC (Minor Module)
· Δ9-THC, THC-A, Total THC (Hemp Compliance)
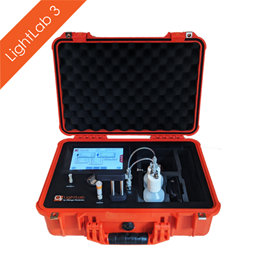
CANNABIS ANALYZER Model
LightLab 3

The accurate and easy-to-use LightLab 3 Cannabis Analyzer lets non-technical users analyze cannabinoid content like a testing laboratory. LightLab uses two common analytical methods, liquid chromatography and spectroscopy, simplifying the process to make on-site testing affordable and easy.
Standard Cannabinoids
- Δ9-THC, THC-A, CBD, CBD-A, CBN, CBG, CBG-A
Minors Module
- CBN-A, CBC-A, CBC, Δ8-THC, Δ10-THC
Hemp Compliance
- Δ9-THC, THC-A, Total THC
Terpenes Module
- Semi-quantitative
Features
- 0-100% Cannabinoid analysis
- Results in 10.5 minutes
- Easy sample preparation
- Portable, rugged
- WiFi enabled
- 8-hour battery life
Sample Types
- Flower, Biomass, Young plant, Concentrates, Processed waste, Tinctures, Infused products, Edibles (Contact us)
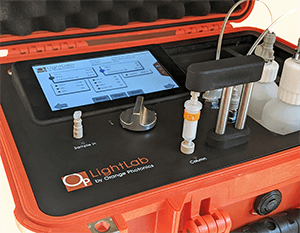
EASY TO USE
LightLab 3 provides lab-grade cannabinoid analysis in a rugged, easy-to-use format. Its touchscreen streamlines and simplifies the entire analytical process so every team member can follow the same workflow to produce consistent results.
- Step-by-step – On-screen instructions guide you through each step of the sample preparation process based upon the sample type you select.
- Accessories – Your LightLab includes all the accessories you need to begin using LightLab right out of the box, including a scale, sample shaker and more.
- Tags – You have the option to include information about your sample including the operator’s name, sample ID etc. Each test result will automatically include date, time etc.
- Factory Calibration – LightLab arrives pre-calibrated and ready-to-use right out of the box. LightLab calibrations use Certified Reference Standards for traceability.
- Mobile Monitoring – LightLab’s Mobile Monitoring feature gives users the ability to remotely track testing progress from start to finish from a smartphone.
- Results – The results from your most recent tests, as well as previous tests, may be viewed on the screen, exported as a CSV file and shared via text or email directly from LightLab.
- Pro Mode – Advanced technical LightLab users may bypass guided screens to streamline workflow in Pro Mode and access chromatograms.
- Workbench Setup – If you run a high volume of tests from stationary workstation, a Workbench Setup will let you run more tests at a lower cost-per-test.
RESULTS
Sample analysis results are available in five formats.
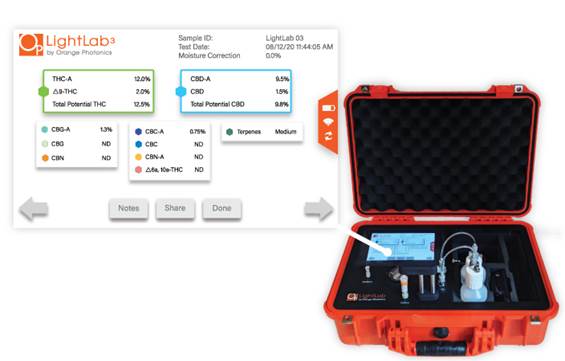
1. On-screen – After you run your sample, your results will populate on LightLab’s screen. From this screen you can add additional details about the sample by tapping “notes” or you can tap “done” and run your next sample. You may also scroll through your test history to compare results.
2. Spreadsheet – LightLab provides a results spreadsheet (CSV) which gives you maximum flexibility and the opportunity to further analyze sample results in aggregate.
3. Report – You can use the CSV file to generate a full report, containing all the details about the sample you ran, including all inputted information such as moisture correction, operator, sample size and more.
4. Text and email – Once your LightLab is set-up on your Wi-Fi, you can share your results via text or email.
5. Mobile Monitoring – Get an instant notification when your test results are ready; view and share those results straight from your smartphone.
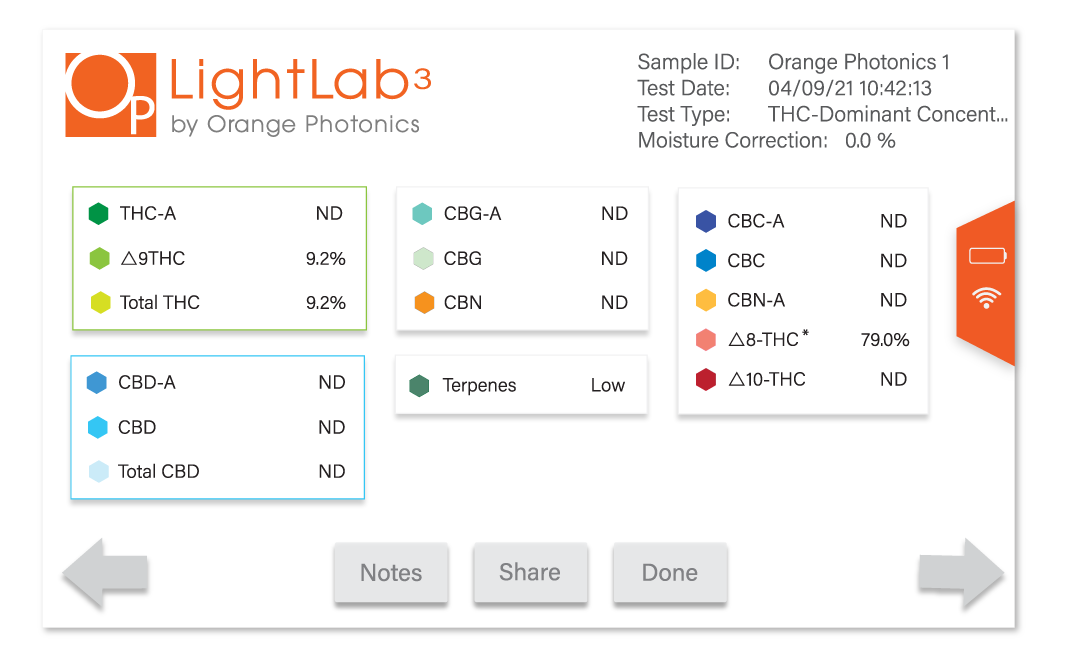
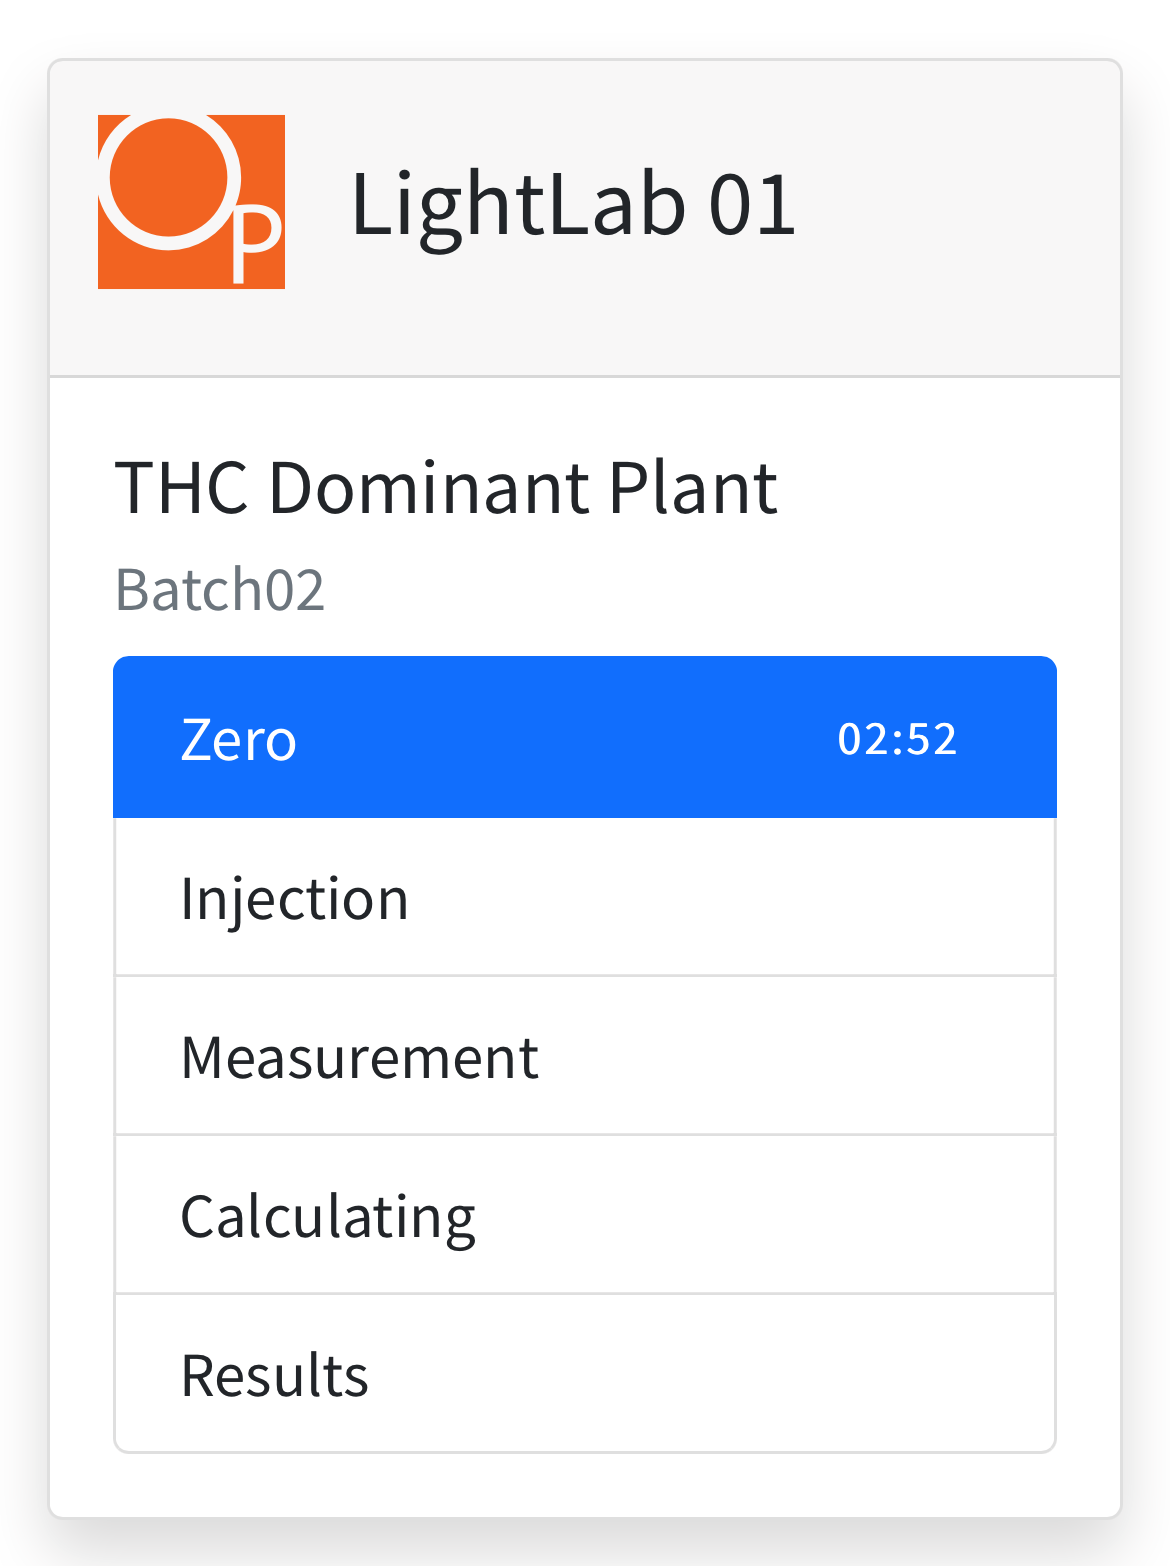
LightLab 3 results screen, all current modules shown.
Orange Photonics LightLab Brochure
LightLab 3 may be customized to meet your testing needs. LightLab’s standard configuration can report seven cannabinoids and additional modules can add greater capabilities to your LightLab.
Hemp Compliance
Compounds
- Δ9-THC, THC-A, Total Potential THC
Product
- Flower, Biomass, LOD 0.05%
Users
- Cultivators, Processors, Regulators
Terpenes
Compounds
- Semi-quantitative, Low, medium, high
Product
- Flower, Concentrates, Infused
Users
- Cultivators, Processors
Minors
Compounds
- CBN-A, CBC, CBC-A, Δ8-THC, Δ10-THC
Product
- Flower, Concentrates, Infused
Users
- Cultivators, Processors, Breeders
HEMP COMPLIANCE MODULE
On-site THC compliance testing has never been easier. LightLab’s Hemp Compliance Module takes the guess work out of crop monitoring delivering THC-A, D9-THC and Total Potential THC content between .05% and 3% with high precision. The additional capabilities, combined with LightLab’s cannabinoid panel tests, will allow you to get a complete picture of your crop’s cannabinoid production with real-time data.
- Monitor CBD/THC ratios
- Harvest at peak
- Schedule Department of Ag visits at the right time
- Verify Certificates of Analysis
- Evaluate biomass
Learn more about the Hemp Compliance Module here
TERPENES MODULE
Terpene molecules are responsible for the scent profiles of cannabis plants and products. They offer an indication of freshness, they impact the consumption experience, guide consumer preference and support product differentiation.
With the Terpenes Module, LightLab can analyze the richness of the sample’s terpene content without any changes in sample preparation or hardware upgrade.
Semi-Quantitative Analysis
Over 100 cannabis terpenes have been identified to date and those terpenes generally fall into two categories: monoterpenes and sesquiterpenes. Monoterpenes comprise 80% of cannabis terpenes. LightLab can analyze and quantify the monoterpenes present in a sample and uses that analysis to make an assumption about the monoterpene-sesquiterpene ratio in the sample. LightLab reports terpene content in samples as low, medium or high terpene content offering a great first-line analysis that can help cultivators and processors understand and value their product when terpene rich products are the end goal.
Low Terpene Range:
<1%
Medium Terpene Range: between 1% and 2%
High Terpene Range: >2%
No additional steps are required beyond the standard liquid extraction used for LightLab cannabinoid analysis. In addition, no additional analysis time is needed – LightLab calculates the terpene content at the same time as cannabinoid analysis.
MINORS MODULE
By their very nature, minor cannabinoids are uncommon and can be a valuable product differentiator. These minor cannabinoids in a plant or product can be an indication of unique genetics, an opportunity for product differentiation and measure of plant quality.
LightLab’s Minors Module analyzes the following five cannabinoids:
- CBC-A: Cannabichromenic Acid. CBC-A is the acidic form of CBC. It is non-psychoactive and is formed in some plant genetics alongside THC-A and CBD-A, typically at lower concentration. It’s a precursor is CBG-A. Some genetics will exhibit 1-5% CBC-A.
- CBC: Cannabichromene. CBC is the neutral form of CBC-A. CBC is often present in hemp and CBD containing plants, and more rarely in THC containing plants. Since many laboratories do not yet measure CBC, the Minors Module will allow hemp farmers, CBD growers and processors to select for higher CBC plants and differentiate their product with a new cannabinoid.
- CBN-A: Cannabinolic Acid. CBN-A is the acidic form of CBN. It is often formed from aged cannabis plants. Very old plants may contain 0-5% CBNA. CBN-A in combination with CBN are good indicators of the age and storage conditions of plant material. Higher CBN-A and CBN typically indicates old plant material or poorly stored plant material.
- Δ8-THC: Delta-8-Tetrahydrocannabinol. Δ8-THC is generally made by converting CBD or Δ9-THC in a chemical reaction. Note that the process used to create Δ8-THC often creates other cannabinoids, including Δ9-THC. When running a Δ8-THC sample, LightLab has a higher detection limit of 4% for flower samples and 12% for concentrates.
- Δ10-THC: Degraded THC, Dihydroxy-THC. In some cases, distillation can breakdown the THC molecule into by-products, reducing the potency of the product and affecting the taste. Two of the major breakdown components are CBN and Δ10-THC. LightLab can measure the amount of Δ10-THC, allowing distillation operators to ensure their product is pure and potent while maintaining high throughput. In some cases, extraction operators will intentionally attempt to generate novel cannabinoids through a degradation process. Δ10-THC is a precursor to most of the degradation products generated.
HOW IT WORKS
Built for Cannabis. Built for Performance.
LightLab was designed to be easy-to-use and deliver lab-grade accuracy. LightLab applies liquid chromatography which separates the cannabinoids, spectroscopy which uses light to analyze the sample’s compounds and linear regression mathematics to calculate sample results.
HIGH PERFORMANCE LIQUID CHROMATOGRAPHY
Your analytical laboratory likely uses High Performance Liquid Chromatography (HPLC) to analyze your hemp or cannabis sample. Like an HPLC, LightLab pushes an extracted cannabis sample through a column. The column separates the cannabinoids in the sample by slowing down cannabinoids by different amounts based on their affinity to the column. This allows each cannabinoid to exit the column at a different time. For example, CBD may exit the column first, then D9THC and so on. Once the column separates the cannabinoids, they move to the next step in the analytical process: spectroscopy.
ULTRAVIOLET SPECTROSCOPY
Spectroscopy uses light to measure the analytical composition of compounds. During the analytical process the sample flows between a light source and a detector. The detector will quantify how much light is getting through the sample. Since every cannabinoid has a particular light absorption signature LightLab can provide quantitative measurements. LightLab borrows spectroscopy technology from the Curiosity Mars Rover, providing an accurate and dependable analysis every time.
LIGHTLAB CHROMATOGRAM AND CALCULATIONS
When LightLab analyzes a sample, it separates cannabinoids over time and detects them with UV light at several wavelengths. An HPLC works in much of the same way, though in many cases only one wavelength of light is utilized. In a standard HPLC, the chromatogram shows peaks that represent different analytes; the area of the analyte is correlated with the concentration of that analyte. While LightLab uses the chromatogram as part of its analysis, the calculation is not a strict peak area calculation. Instead, LightLab uses a sophisticated multi-dimensional, non-linear regression to calculate results. This algorithm uses multiple UV wavelengths along with the chromatogram to determine the final results. This allows for a more robust and accurate measurement of cannabinoids even with challenging environmental conditions and complex samples.
RESULTs
Track. Share. Compare.
It has never been easier to track, share and manage your test data. Track test progress from your mobile device, share test results, and generate a Certificate of Analysis complete with authenticity verification controls.
Click image and scan QR code to reveal Result Dashboard
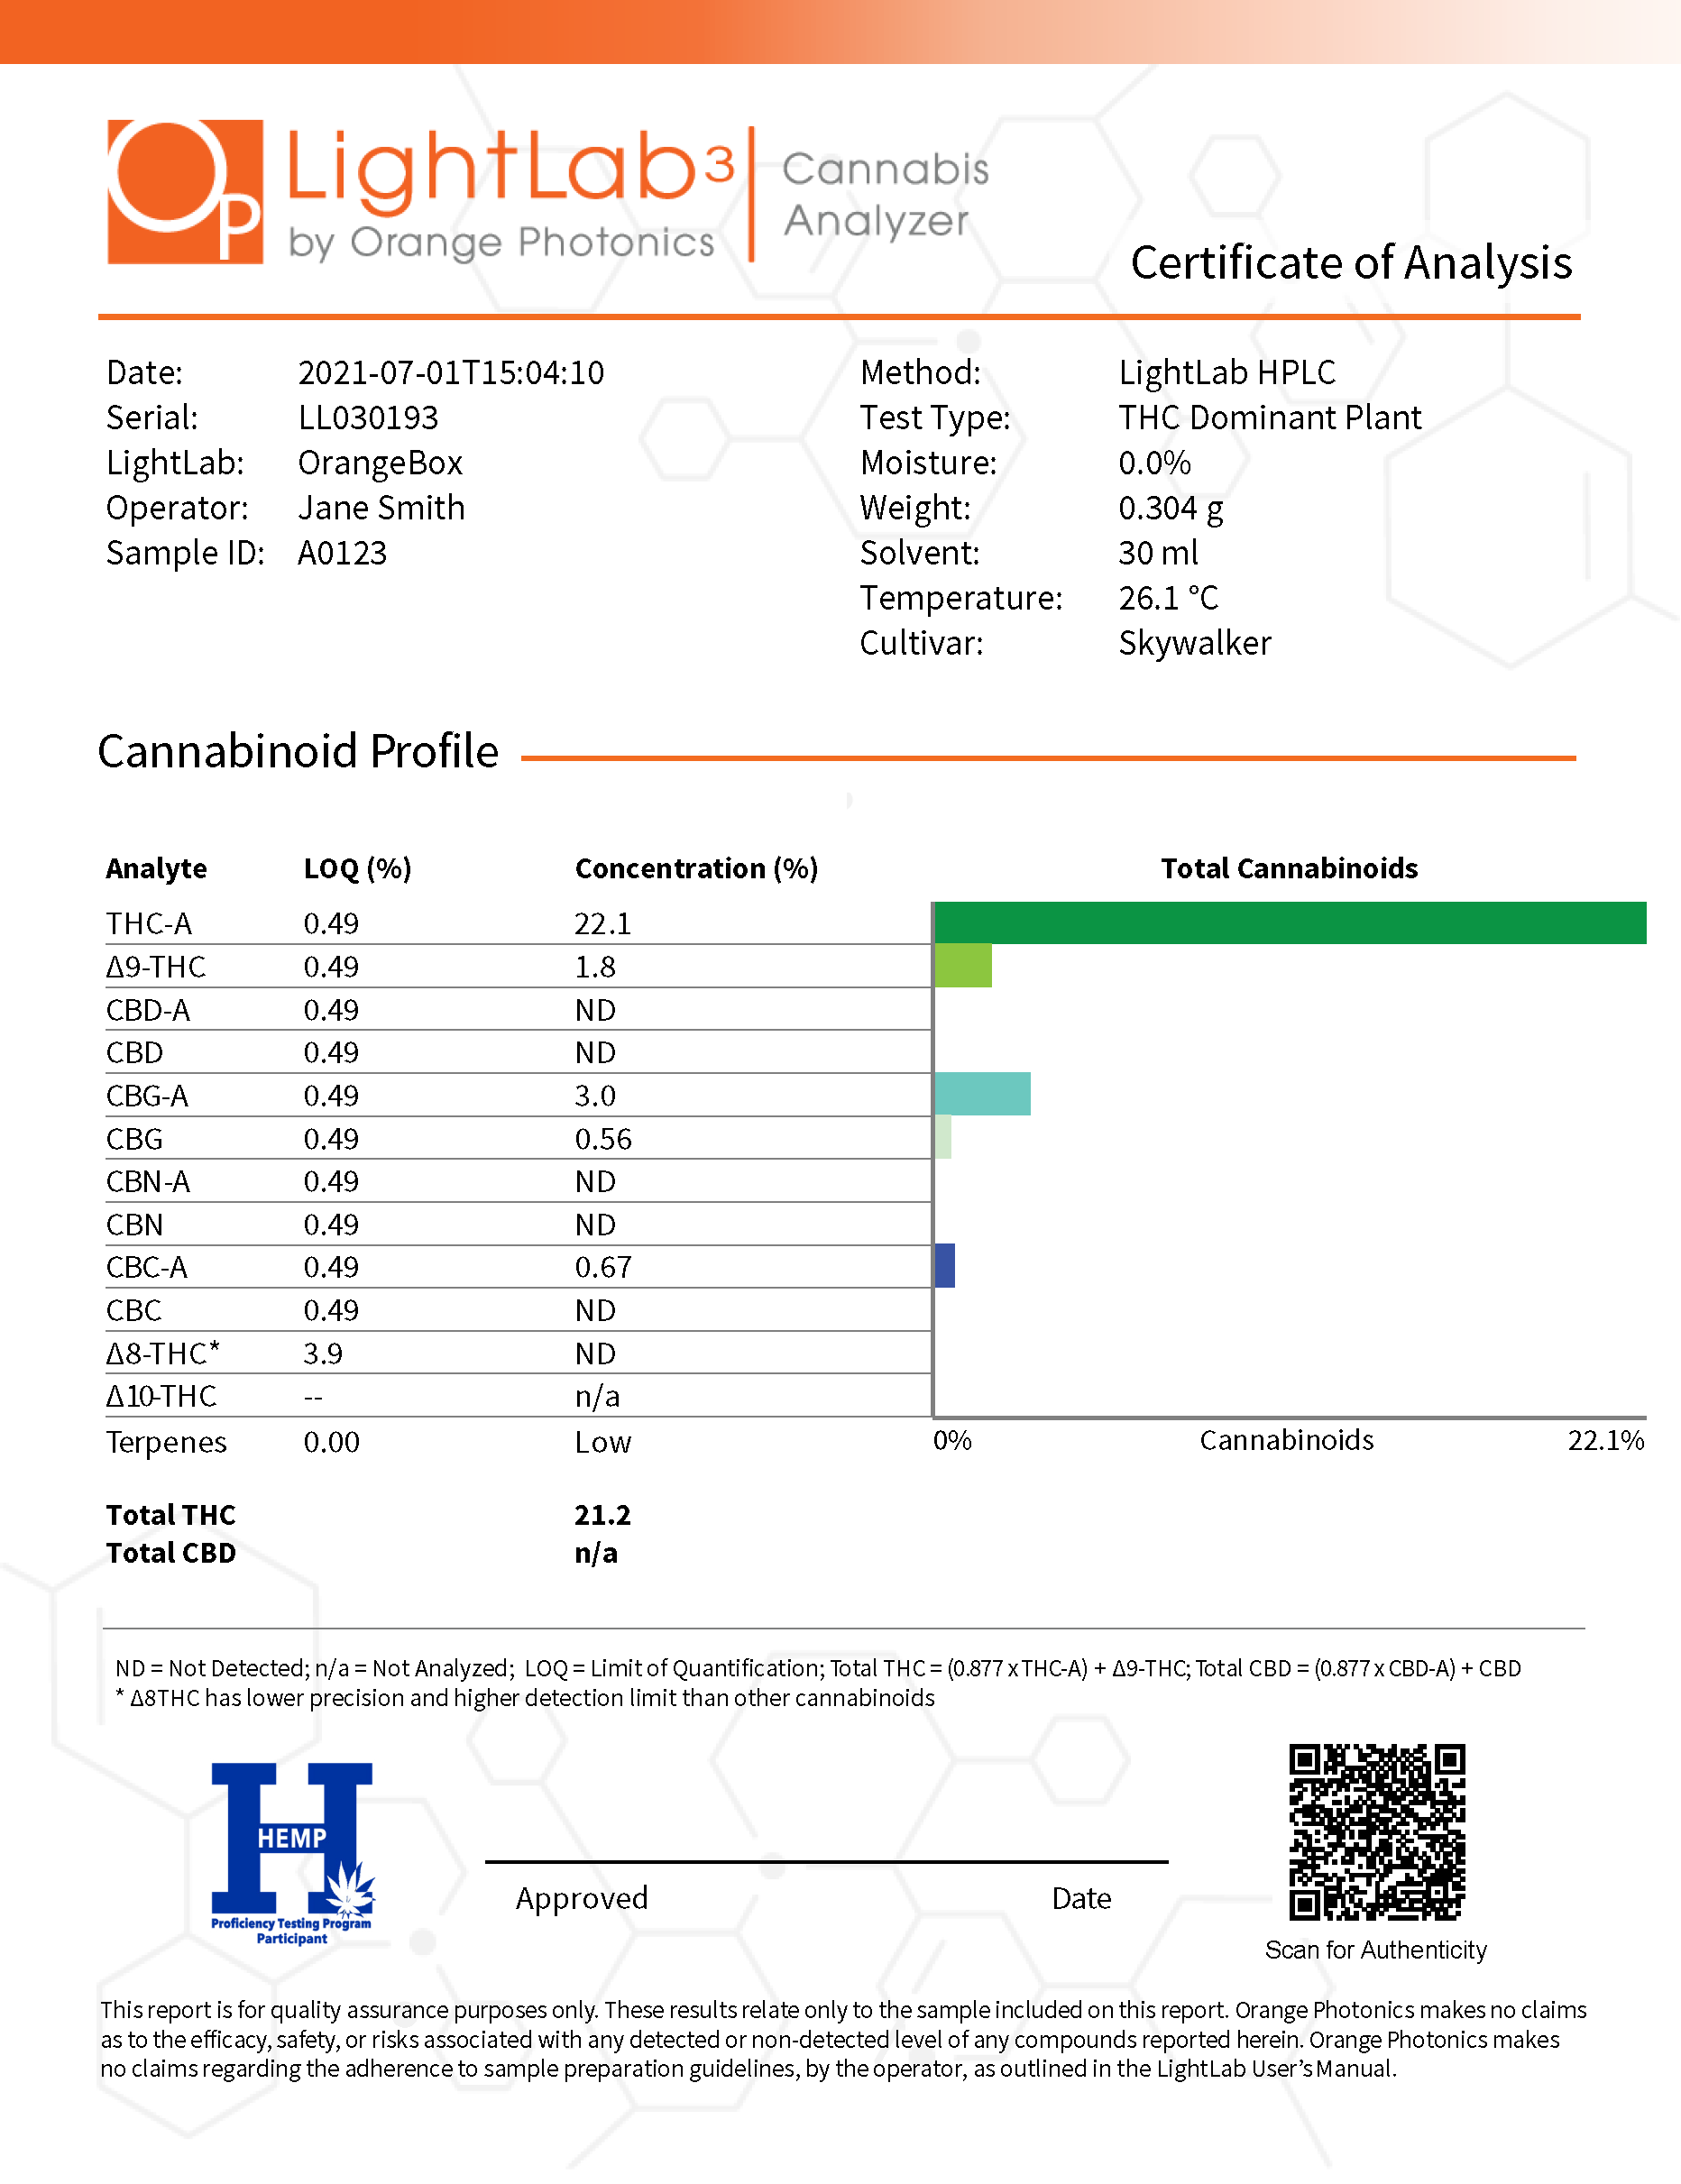
CERTIFICATE OF ANALYSIS
Generate a Certificate of Analysis (CoA) with the click of a button. The CoA reports the cannabinoid content of the sample in weight percent, limits of detection, user inputted sample identifiers, and automatically generated information such as time stamp and instrument serial number. A QR code on the report corresponds with the original test results and confirms the authenticity of the report itself.
MOBILE MONITORING
LightLab’s Mobile Monitoring feature gives users the ability to remotely track sample test progress, start to finish from a smartphone. This gives users the ability to step away from their LightLab and tend to other tasks while running a test. LightLab sends notifications when the next step of the testing process is ready and redirects to the Result Dashboard when the test is complete.
RESULT DASHBOARD
When a test is complete, a unique QR code is generated that brings you to a Result Dashboard, populated through an internet webpage. The Result Dashboard displays sample details and final results. From this page you can share your data to your social media pages or contacts, generate an official Certificate of Analysis, and download a CSV report.
RESULTS
Sample analysis results are available in five formats.
1. On-screen – After you run a sample, the results will populate on the LightLab. From this screen you can add additional details about the sample by tapping “Notes,” tap “Done” to run your next sample, or select “Share” to share your results via email or text. The share feature has two options for sending results; send the Certificate of Analysis or choose to send the Result Dashboard.
2. Certificate of Analysis – An official Certificate of Analysis (CoA) which includes user inputted sample identifiers and final results.
3. Result Dashboard – The Result Dashboard is a unique webpage displaying sample details and final results. From this page you can generate an official Certificate of Analysis, download a CSV report, and share sample details.
4. Report – You can use the CSV file to generate a full report containing the details about the sample you ran, including all inputted information such as moisture correction, operator, sample size and more.
5. Text and Email – Once your LightLab is set-up on Wi-Fi, you can share your results via text or email. Sharing capabilities include an official Certificate of Analysis or the Results Webpage.
CALIBRATION
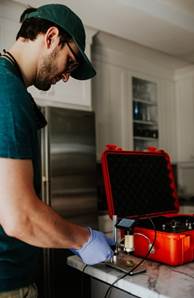
District Derp’s Co-Owner, Chris, running samples on LightLab. Look for District Derp on social media to learn about their cutting-edge operation.
LightLab 3 is shipped to you calibrated and ready to run. After you have run 1,000 tests or after one year, whichever comes first, return your LightLab to Orange Photonics for a calibration service. LightLab calibrations use Certified Reference Standards.
The only hands-on maintenance required is the easy task of replacing the Selective Separation Column every 25 tests. LightLab runs a self-cleaning cycle automatically and therefore it does not require manual cleaning or flushing.
LIGHTLAB OPERATING EXPENSE
Like all lab-based liquid chromatography instrumentation, LightLab uses solvent to extract the cannabinoids from the sample. The same LightLab Extraction Solvent is also used as a carrier solution (mobile phase). LightLab Plant or Concentrate Test Kits include everything you need to run a sample in one economic package that includes vials, syringes, solvents, filters and Selective Separation Columns. Cost per test varies depending on the volume of tests required, but typically fall in the $3-5 price range.
LIGHTLAB WARRANTY
Your LightLab Cannabis Analyzer comes with a standard one-year factory warranty. An extended 2-year warranty option with calibration service is available.